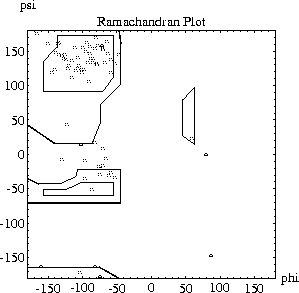
Figure 5.2: Ramachandran plot.
The following example shows how to make a Ramachandran plot:
X-PLOR produces the file ramachandran.list, which can be interpreted by Mathematica using the following file:
The resulting plot is shown in Fig. 5.2.

Figure 5.2: Ramachandran plot.