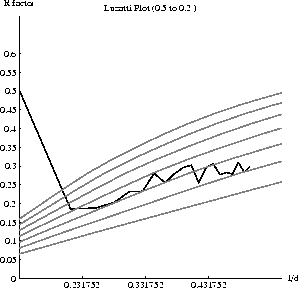
Figure 12.1: Luzzati plot.
The R value as a function of resolution and intensity can be obtained by issuing the PRINt R statement after structure factors have been computed. The output of the PRINt R statement can be used to make a plot of the R value distribution, the so-called Luzzati plot (Luzzati 1952). In the following example, the X-PLOR script file creates a file ``luzzati.list":
The following Mathematica script can be used to make the Luzzati plot shown in Fig. 12.1: